The Boring Part of Bell Labs

It took me a long time to realize that Bell Labs was cool. You see, my dad worked at Bell Labs, and he has not done a single cool thing in his life except create me and bring a telescope to my third grade class. Nothing he was involved with could ever be cool, especially after the standard set by his grandfather who is allegedly on a patent for the television. 

It turns out I was partially right. The Bell Labs everyone talks about is the research division at Murray Hill. They’re the ones that invented transistors and solar cells. My dad was in the applied division at Holmdel, where he did things like design slide rulers so salesmen could estimate costs.

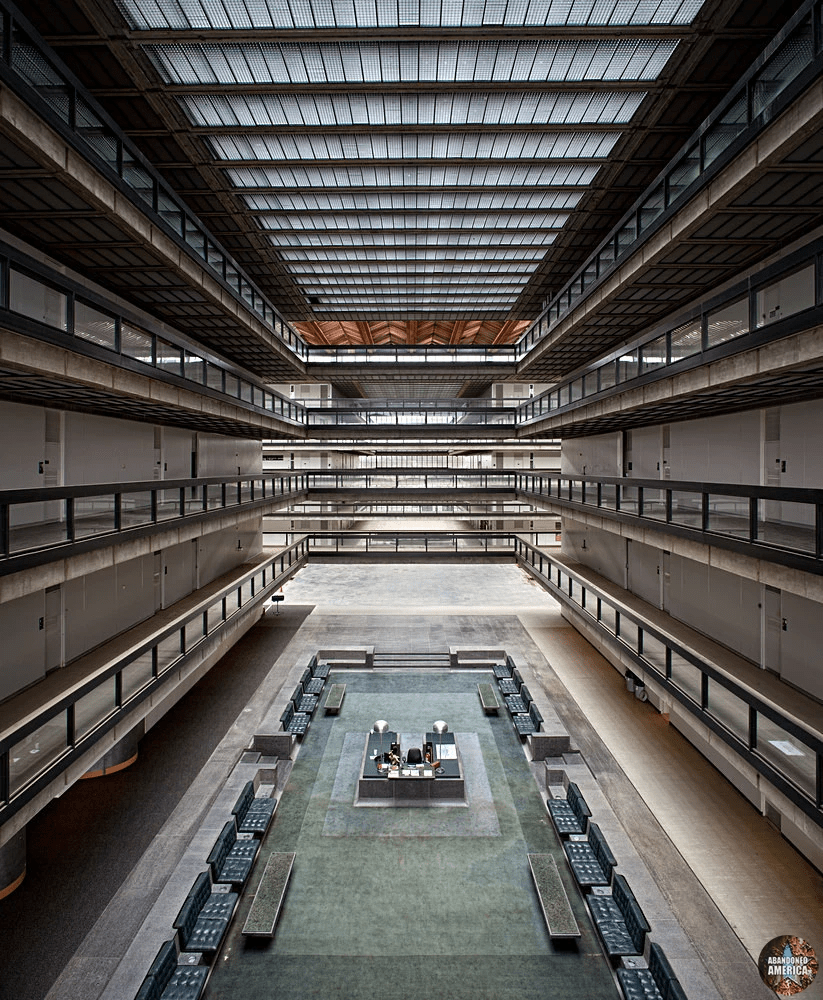
[Fun fact: the old Holmdel site was used for the office scenes in Severance]

But as I’ve gotten older I’ve gained an appreciation for the mundane, grinding work that supports moonshots, and Holmdel is the perfect example of doing so at scale. So I sat down with my dad to learn about what he did for Bell Labs and how the applied division operated. 

I expect the most interesting bit of this for other people is Bell Labs’ One Year On Campus program, in which they paid new-grad employees to earn a master’s degree on the topic of Bell’s choosing. I would have loved to do a full post on OYOC, but it’s barely mentioned online and my only sources are 3 participants with the same degree. If you were a manager who administered OYOC  or at least used it for a degree in something besides Operations Research, I’d love to talk to you (elizabeth@northseaanalytics.com).

And now, the interview

Elizabeth: How did you get started at Bell Labs?

Craig: In 1970 I was about to graduate from Brown with a ScB in Applied Math. I had planned to go straight to graduate school, and been accepted, but I thought I might as well interview with Bell Labs when they came to campus.  That was when I first heard of the One Year On Campus program, where Bell Labs would send you to school on roughly 60% salary and pay for your tuition and books, to get a Masters degree.  Essentially, you got a generous fellowship and didn’t have to work as a teaching or research assistant, so it was a great deal.  I  got to go to Cornell where I already wanted to go, in the major I wanted, operations research.   

Over 130 people signed up for the One Year On Campus program in 1970.  That was considerably more than Bell Labs had planned on; there was a mild recession and so more people accepted than they had planned.  They didn’t retract any job offers, but the next year’s One Year On Campus class was much smaller, so I was lucky.

The last stage in applying was taking a physical at the local phone operating company.    Besides the usual checks, you had to look into a device that had two lighted eyepieces.  I looked in and recognized that I was seeing a cage in my left eye and a lion in my right eye.  But I also figured out this was a binocular vision test and I was supposed to combine the two images and see the lion in the cage, so that’s what I said I saw.   It’s unclear if Bell Labs cared about this, or this was the standard phone company test for someone who might be driving a phone truck and needed to judge distances.  Next time I went to an eye doctor, I asked about this; after some tests, he said I had functional but non-standard depth perception.    

What did you do for Bell Labs?

I worked in the Private Branch Exchange area.  Large and medium size companies would have small telephone exchanges that sat in their buildings.  It would be cheaper for them because most of the calls would be within the building rather than to the outside world, and thus avoid sending the call to a regular exchange a number of miles away and then back to the building.  You could also have special services, like direct lines to other company locations that you could rent and were cheaper than long distance charges.  The companies supplied their own phone operators and the operating companies were responsible for training, and the equipment and its maintenance and upgrades.  

Most calls went through automatically e.g. if you knew the number.  But some would need an operator.  Naturally, the companies didn’t want to hire more operators than they needed to.  The operating company would do load measurements and, if the number of calls that needed an operator followed a Poisson distribution (so the inter-arrival times were exponential).

The length of time an operator took to service the call followed an exponential distribution. In theory, one could use queuing theory to get an analytical answer to how many operators you needed to provide to get reasonable service.  However, there was some feeling that real phone traffic had rare but lengthy tasks (the company’s president wanted the operator to call around a number of shops to find his wife so he could make plans for dinner (this is 1970)) that would be added on top of the regular Poisson/exponential traffic and these special calls might significantly degrade overall operator service.

I turned this into my Master’s thesis. Using a simulation package called GPSS (General Purpose Simulation System, which I was pleasantly surprised to find still exists) I ran simulations for a number of phone lines and added different numbers of rare phone calls that called for considerable amounts of operator time. What we found was that occasional high-demand tasks did not disrupt the system and did not need to be planned for. 

Some projects I worked on:

  • A slide rule for salesmen to estimate prices on site, instead of making clients wait until the salesman could talk to engineering.
  • Inventory control for parts for PBX.
  • I worked with a Ph. D.  mathematician on a complicated call processing problem.  I ran a computer simulation and he expanded the standard queuing theory models to cover some of the complexities of reality.  We compared results and they were reasonably similar. 

Say more about inventory control?

The newest models of PBX’s had circuit packs (an early version of circuit boards), so that if a unit failed, the technician could run diagnostics and just replace the defective circuit pack.  The problem was technicians didn’t want to get caught without a needed circuit pack, so each created their own off-the-books safety stocks of circuit packs.  The operating company hated this because the circuit packs were expensive, driving up inventory costs, and further, because circuit packs were being constantly updated, many off-the-book circuit packs were thrown out without ever having been used.  One operating  company proceeded with inspections, which one technician countered by moving his personal stock to his home garage. 

This was a classical inventory control problem, a subcategory of queuing theory.  I collected data on usage of circuit packs and time to restock, and came up with stocking levels and reorder points.  Happily, the usual assumptions worked out well.  After a while, the technicians were convinced they were unlikely to get caught short, the company was happy that they had to buy fewer circuit packs and they were accessible to all the technicians.  Everyone was happier.

And the slide rule?

While I was in graduate school, I became interested in piecewise linear regression (aka segmented regression), where at one or more points the regression line changes slope, jumps (changing its intercept) or both. 

I considered working on PLR for my Ph.D. dissertation.  On my summer job back, I saw a great fit with a project.  Salespeople would go out to prospective PBX customers but be unable to give them a quick and dirty cost estimate for a given number of phone lines, traffic load, etc.  It was complicated, because there were discontinuities:  for example, you could cover n phones with one control unit, so costs would go up linearly with each additional phone.  But if you had n +1, you had to have two control units and there would be a noticeable jump in costs.  There were a number of wrinkles like this. So the salesperson would have to go back to the office, have someone make detailed calculations and go back out to the customer, which would probably lead to more iterations  once they saw the cost.

But this could be handled by piecewise regression.  The difficult problem in piecewise regression is figuring out where the regression line changes, but I knew where they were:  for the above example, the jump point was at n+1.  I did a number of piecewise regressions that captured the important costs  and put it on a ….

I bet you thought I was going to say a programmable calculator.  Nope, this was 1975, and the first HP had only come out the year before.  I had never seen one and wouldn’t own one for two more years.  I’m not sure I could have gotten the formulae in the hundred line limit anyway. The idea of buying one for each salesperson and teaching them how to use them never came up.  I designed a cardboard slide rule for them.   

I found piecewise regression useful in my work.  But that summer I recognized that research in the area had sputtered out after a couple of years, so I picked another topic for my dissertation. 

Elizabeth: What did you do after your masters degree?

Craig: I worked at Bell Labs for a year, and then started my PhD in statistics at UWMadison. There were no statistics classes worth taking over the summer, so I spent all four summers working at Bell Labs. 

How was Bell Labs organized, at a high level?

I interviewed for a job at Murray Hill, where the research oriented Bell Labs work was done.  The job involved anti-ballistic missile defense and no secret details were gone into.  I didn’t get that job. I worked in a more applied location at Holmdel.

I did go to one statistical conference at Murray Hill.  The head of the statistical area there was John Tukey, a very prominent statistician.  He simultaneously worked at Bell Labs and was head of the Princeton Statistics Department.  You don’t see much of that any more.

There was a separate building in the area that did research in radio telescopes.  This was an outgrowth of research that investigated some odd radio interference with communication, that turned out to be astronomical.  I was never in that building.

However, Bell Labs didn’t skimp on the facilities at Holmdel.  It had an excellent library with everything I needed in the way of statistics and applied math.  The computer facilities were also first-rate, comparable to that at the University of Wisconsin where I got my PhD.  

Holmdel worked with the operating phone companies who provided actual phone service in their own geographical areas.  People at Holmdel would sometimes take exchange jobs at operating companies to better understand their problems.  One of these came back from a stint in New York City and gave a talk where he showed a slide of people pushing a refrigerator out of an upper story window of a derelict building while a New York Tel crew was working underneath them.

A more common problem was that by the time I was there, technicians were not as bright as they had been.  A bright person who could not afford to go to college or maybe even finish high school in 1940 and had become a technician in an operating phone company had kids who could go to college, become engineers and be about to start work at Bell Labs in 1970.

How was management structured?

My recollection was that a first line-manager had a mean of 8 or 9 people.  This varied over time as projects waxed and waned.  I have a feeling that new first-line managers had fewer people but I don’t ever recall hearing that officially.  

There was a different attitude about people (or maybe it was a different time).  My boss at Bell Labs had told them he was resigning to work at another company.  An executive vice president came to visit him, said he had a bright future at Bell Labs and suggested he’d wait a while.  He decided to and was soon promoted.  

Feedback was mostly given by yearly performance appraisals, as it was at all the companies I worked for.  Occasionally you’d get informal feedback, usually when some client was unhappy. 

Bell Labs was big on degrees.  To be a Member of Technical Staff you had to have electrical engineering classes and a Masters degree or on a path to get one. They were willing to pay for this.

What were the hours like?

For me it was a regular 9 to 5 job.  I assume managers worked longer and more irregular hours but no one ever asked me to work late (I would have done if they’d asked).  The only time I can remember not showing up at 9 was when I got in really late from a business trip the night before.  

There was a story I heard while I was at Bell Labs which I have no idea is true.  Walter Shewhart worked at Bell Labs.  In 1956, he was 65, and under the law at the time, had to retire.  The story goes that they let him keep an office, in case he wanted to stop by.   Instead, he kept showing up at 9 and working until 5 every weekday.  Eventually, they took the office away from him. 

Who decided what you worked on? What was the process for that?

To be honest, I didn’t think much about that.  I got my jobs from my first line manager.  I kept the same one for my entire time at Bell Labs; I don’t think that was common.  You may have noticed that I did a lot of  work in the queuing and inventory area; my Master’s thesis was in that area and I’m guessing that my boss saw I was good at it and steered those kind of jobs to me.  With my last task, getting a rough pricing approximation for PBX’s, I was handed the job, saw that piecewise regression was a great solution, talked to my boss about it and he let me do it that way. I don’t know how jobs got steered to him.

What was the distributions of backgrounds at Bell Labs? 

I went with to Cornell for One-Year-On-Campus. Of the 5 people in my cohort: I was from Brown, one from Cornell, one from University of Connecticut and one from Indiana.  So I’d say they were from at least good schools, so that the Labs would be sure they would be able to compete at Cornell.

Not everybody at the Labs came from elite schools.  As the most junior member of the unit, who knew less about phones then anybody else, I didn’t enquire about their resumes.   I was berated by one of members of my group for using meters for a wavelength in a meeting instead of “American units”.  He had a second part-time job as a stock-car racer, but while I was there he decided to quit after his car was broken in half in a crash.   Another man in my group had a part-time job as a photographer.  When I came back from Cornell for my Christmas check-in at Bell Labs, he was dead in a train “accident”.  Local consensus was that he had been working on a divorce case and got pushed in front of a train

My impression was that Bell Labs didn’t poach much from other technical companies.   They wanted to hire people out of school and model them their own way.  

Since the One-Year-On-Campus people were sharp and had Master’s, a lot of them got poached by other companies.  Of the five people I kept track of, all five had left the Labs within five or six years.  

As to age distribution, there were a considerable number of young people, from which there was considerable shrinkage year to year.  After five to 10 years, people had settled in and there was less attrition.  They were good jobs.  Although not as numerous (I think because the Labs had expanded), there were a number of people who had been there for decades.  

How independent was your work?

I did work with that Ph. D. mathematician on a queuing problem.

I can’t believe that they let me work on my own project in the two months between when I arrived at Holmdel before I left for Cornell.  But  I don’t remember what it was.

In retrospect, I am surprised that the Labs let me interview possible hires by 1972 when I’d only been around for a year (not counting the year at school).  Admittedly, I was supposed to assess their technical competence.  I think I did a good job; I recommended not hiring someone who they hired anyway. I later worked with her and my judgement was correct.  She was gone within a year.

Tell me more about One Year on Campus

Bell Labs would pay tuition and expenses for a master’s degree along with 60% of your salary, as long as you graduated in the first year. There also was an option to stay on full salary and go to grad school part time, but I didn’t do that. You could theoretically do this for a PhD but it was much harder to get into; I only knew one person in my division who did so.

One qualification was that you had to have a year of electrical engineering (or spend a year at the Labs before going).  Fortunately, although my degree was in Applied Math, I had taken some electrical engineering as an elective. Partially out of interest, and partially because my grandfather had worked his way up to being an electrical engineer  [note from Elizabeth: this was the grandfather on the television patent]. 

An important caveat was that you need to get your degree completed in a year or you would be fired.  I never heard of this actually happening, but I was motivated.

Bell Labs would also pay for you to take classes part-time and give you a half-day off; I went to the stat department at Columbia and took my first design of experiments class there and fell in love.  

What was so loveable about experimental design?

My love affair with design of experiments started in my first class on the subject.  The professor told a story of attending at a conference luncheon at Berkley and was seated between two Nobel laureates in physics.  One of them politely asked him what he did and the professor gave him this weighting design example.

You have a balance beam scale, where you put what you want to weight on one side and put weights on the other side until it balances.  You’re in charge of adding two chemicals C1 and C2 to a mixture. They come in packages with nominal weights, but the supplier is sloppy and the precise ratio of them is important to the quality of the mixture.  However, this is a production line and you only time to make two measurements per mixture.  What two measurements do you do? 

The obvious answer is you weigh C1 and then you weigh C2.

But this is wrong.  A better solution is to put C1 and C2 in the same pan and get their combined weight WC.  Then you put C1 in one pan and C2 in the other, and you get the difference between them, WD. Then if you add WC + WD, the weight of C2 cancels out and you get an estimate of 2*C1.  If you subtract WD from WC, the weight of C1 cancels out and you get an estimate of 2*C2.  Notice that you’ve used both weighings to determine both weights.  If you run through the math, you get the same precision as if you weighed both chemicals twice separately, which is twice the work.

The physicist got excited. The other Nobel laureate asked what they were talking about, and when he was told, said: “Why would anyone want to measure something more precisely?”.  That is the common reaction to the design of experiments.

But even more important than efficiency, designed experiments can inform about causality, which is very difficult to determine from collected observed data.  Suppose there is impurity that varies in a feedstock that is fed into a chemical reactor that lowers the quality of the output but we don’t know this.  The impurities also cause bubbles, which annoy the operator, so he/she increases the pressure to make them go away.  If we look at a plot of quality vs. pressure, it will look like quality decreases as pressure increases (when actually it has nothing to do with it; correlation does not imply causality). But if we run a designed experiment, where we tell the operator which runs are supposed to be run at high pressure and which are to be run at low pressure, we have a good shot of figuring out that pressure has nothing to with quality (the greater the number of experiments, the better the odds).  If we then talk with the operator and they explain why they increase pressure in production, we have a lead on what the real problem might be.   

What if you don’t care about efficiency or causality?  The following example is borrowed from Box, Hunter and Hunter “Statistics for Experimenters”, first edition, pp. 424ff.  A large chemical company in Great Britain makes fertilizer. Because the cost of fertilizer is low, transportation costs are a noticeable part of it, so when demand goes up, instead of adding onto a current plant, they build a standard plant at a blank spot on the map. Unfortunately, this new plant’s filtration times nearly doubles, meaning this multi-million pound plant (currency, not weight) is operating at half capacity.  Management goes nuts.  There is a very contentious meeting that comes up with 7 possible causes.  Box comes up with a first round plan to run 8 experiments.  This is the absolute minimum, since we need to estimate the mean and the seven effects.  This is important, because we’re not doing experiments in a flask, but in a factory.  Changing one factor involves putting a recycle device in and out of line, etc., so it won’t be quick.

What do you do?  The usual reaction is to do a one-at-a-time experiment, where we have a base level (the settings of the last plant previously built) and then change one factor at a time.  This is generally a bad idea and, as we shall see, this is a particularly bad idea in this case.  First, as a multiple version of the weighing design, we only use two points out of the eight to determine the importance of that factor.  And suppose we botch the base level?

Instead, Box did a fractional factorial design, with eight design points such that we code a factor levels  as 1 if it’s at the factor level of the working correctly  plant and -1 at the new plant’s settings.

Then if we add the four settings of, say factor 1, that are 1 and subtract the four that are -1, we estimate 8 times the distance between the new pant and the neutral 0 settings and and all other factors are at their neutral setting.  Similarly for all the factors.  Box used the fractional factorial design that included all old plant settings.  Its filter time was close to the old plant’s, which reassures us we have captured the important factors.  If we do the same for all factors, the magnitudes of factors 1, 3, and 5 are considerably larger than the other four.  However, chemistry is interaction and each of the large magnitude factors is confound with the two-factor of the other two large magnitude factors.  Fortunately, we can run an additional eight runs to estimate triplets of two factor interactions, because we didn’t blow our whole budget doing one-at-at-time experiments.  It turns on that the triplet that includes factor 1*factor 5 interaction has a large magnitude interaction, which could reasonably explain why the original factor 3 estimation magnitude appeared to be large.  However, management wanted to be sure and ran a 17th experiment with factor 1 (water) and factor 5 (rate of addition of caustic soda) at the old plant settings and the other 5 were left at the new settings.  The filtering time returned to the desirable level.  Notice if we had done a one-at-time experiment we would never have been able to detect the important water*(rate of addition of caustic soda).  There is a feeling that a lot of tail-chasing in industrial improvement is due to interactions not being recognized.

Another element of experimental design is blocking, where we suspect there are factors that we care about, like four different types of fertilizer and others don’t care about (say hill top land, mid-hill land and bottom land) but may effect the yield.  The solution is to block so that each of the four fertilizers gets an equal share of the three land types.  This eliminates the noise due to land type

Finally, within the limits of blocking, we wish to randomly assign treatments to factor settings.  This provides protection against factors that we don’t realize make a difference.  There was a large stage 2 cancer vaccine study which showed that the treatment group lived 13 months longer than the control group.  The only problem was that who got the treatment was not decided at random but by doctors.  It went on to a much more expensive stage 3 trial, which found no statistically significant difference between the vaccine and the control groups.  What happened?  It is surmised that since doctors can make  a good guess at your prognosis and desperately want to have another tool to fight cancer, that they unconsciously steered the less sick patients to the vaccine group.         

Thanks to my Patreon Patrons for supporting this post, and R. Craig Van Nostrand for his insider knowledge

A different observation of Vavilov Day

At this time last year, I was in the middle of a 36 hour fast in honor of Nikolai Vavilov and his team, who starved themselves to preserve a seed bank that went on to dominate Russian agriculture.* One reason I did that was to honor the team and their sacrifices, but another was to test and develop my own ability to do hard things when necessary. It was a great experiment, I did better than I thought I would but also the costs took longer to repay than I thought, and all of that knowledge was really valuable to me.

I went back and forth about doing the fast this year. The sense of continuity and retesting myself felt valuable and I’m sad about missing out on them. But I’m currently doing hard things and my capacity to deal with that kind of pain is a limiting reagent right now. Fasting for Vavilov Day would come at the expense of an actual project that matters to me. Delaying real work for a symbolic sacrifice would not only be stupid, it would be bad symbolism. I can’t honor a sacrifice for a cause by sacrificing a cause for symbolism.

So this year I’m not fasting. I do think I’ll want another fast at some point to see how my medical miracle affected things, but it will wait.

*My one sentence here is already simplified from the story as fully known in the West, read the blog post for more. I also suspect a lot of details haven’t made it into English. Last year I looked into hiring a Russian researcher to investigate and even found someone in mid-Febuary, but they put it off one week for a root canal and then had some other excuse the next week so seems like they’re not going to come through.

An Observation of Vavilov Day

Content note: this post contains discussion of starvation.

I aspire to be a person who does good things, and who is capable of doing hard things in service of that. This is a plan to test that capacity.

I haven’t been in a battle, but if you gave me the choice between dying in battle and slowly starving to death, I would immediately choose battle. Battles are scary but they are short and then they are over.

If you gave me a chance to starve to death to generate some sufficiently good outcome, like saving millions of people from starvation, I think I would do it, and I would be glad to have the opportunity. It would hurt, but only for a few weeks, and in that time I could comfort myself with the warm glow of how good this was for other people.

If you gave me a chance to save millions of people by starving, and then put food in front of me, I don’t think I could do it. I would do okay for a few days, maybe a week, but I worry that eventually hunger would incapacitate the part of my brain that allows me to make moral trade-offs at my own expense, and I would wake up to find I’d eaten half the food. I want to think I’d manage it, but if the thought experiment gods didn’t let me skip the hard part with more proactive measures, I’m not confident I could. 

During the siege of Leningrad, scientists and other staff of the Institute of Plant Study faced the above choice, and to the best of our knowledge, all of them chose hunger. 12 of them died for it, the rest merely got close (English language sources list 9 deaths, which is the number of scientists who died in service of the seed bank but not the total number of people). They couldn’t kill themselves because they were needed to protect the food from rats and starving citizens. Those survival odds are better than the certain death of my hypothetical, but they didn’t have the same certainty of impact either, so I think it balances out.

That’s heroism enough, but a fraction of what’s present in this story. Those scientists worked at an institute founded by Nikolai Vavilov, a Soviet botanist who has the misfortune to be right on issues inconvenient to Joseph Stalin. Vavilov’s (correct) insistence that his theories could feed Russians and those of Stalin’s favored scientist couldn’t got him arrested, tortured, and sent to a gulag, where he eventually starved to death. 

In 1979 the seeds Vavilov and his staff protected covered 80% of the cropland of Russia (I have been unable to find more recent number). Credit for scientific revolutions is hard to apportion, but as I reckon it Valilov is responsible for, at a minimum, tens of millions people living when they would have starved or never born, and the number could be closer to a billion.

Nikolai Vavilov is my hero.

Nikolai Vavilov | Biography & Facts | Britannica

In honor of Nikolai Vavilov, I’m doing a ~36 hour calorie fast from dinner on 1/25 (the day before Vavilov died in the gulag) to breakfast on 1/27 (the end of the siege of Leningrad). Those of you who know me know this is an extremely big deal for me, I do not handle being hungry well, and 36 hours is a long time. This might be one of the hardest things I could do while still being physically possible. Moreover, I’m not going to allow myself to just lie in bed for this: I’m committing to at least one physical activity that day (default is outdoor elliptical, unless it’s raining), and attempting to work a normal schedule. I expect this to be very hard. But I need to demonstrate to myself that I can do things that are at least this hard, before I’m called on to do so for something that matters. 

If this story strikes a chord with you to the point you also want to observe Valilov + associates’ sacrifice, I’d enjoy hearing how. I have enough interest locally (bay area California) that there’s likely to be a kick-off dinner + reading the night of the 25th. It would also be traditional for a fasting holiday to end in a feast, but 1/27 is a Thursday and other people have normal jobs so not yet clear how that’s going to shake out. 

Thanks to Clara Collier for introducing me to the story of Vavilov and his institute, Anna Tchetchetkine for finding Russian-languages sources for me, and Google translate for being so good I didn’t need Anna to translate any further.

Review: The End Is Always Near

The date is November 10th, 2019. Covid has plausibly started, but I don’t know it yet. I am a huge fan of Dan Carlin’s Hardcore History podcast, and have been conducting my own lit review on civilizational collapse. I have been eagerly anticipating Carlin’s upcoming book, The End is Always Near, for months (affiliate link). I am in a coffee shop with a friend, very excited to have a dedicated time to read and Epistemic Spot Check it. 

I do not remember what I read. I remember that I lost all interest in Carlin’s podcast afterward, and was so sure I’d remember the problem that I didn’t write it down, which led to 2 years of awkwardly saying “yeah his book was so terrible I lost interest, no don’t remember why, yes I see how that’s less useful for you.” I never checked any claims it made; I’d have records of that, which means that whatever the problem was, it wasn’t just a factual error

I sat down today to read enough of the book to remind myself of why I so vehemently disliked it, and in the course doing so discovered that I had written down the problems in Goodreads, but had forgotten that along with everything else. (I also got the date wrong: I remember starting it in January, but that doesn’t fit because I know I was reading one of its sources in December). My review, in its entirety:

I went in wanting a meaty history book with many claims I could follow up on. In the first few chapters I could only extract a few claims, always what other historians thought (but without countervailing arguments), and it never coheres into models or cruxes.

Mystery solved, I guess. It’s not actually clear to me I should have given up on the podcast based on this, since I don’t remember it having the same problem. But since I already went through all this trouble, let me read a chapter or two and see if I agree with my pre-covid assessment.

Claim: “In many earlier eras of history writing, a large part of the historian’s or author’s goal was to impart or teach some sort of moral lesson, usually by historical example.” (footnote on page 1)

Ah yes, the before times, when people manipulated nominally factual data to their own ends. So glad we grew out of that in … *checks watch* … hmmm, must be broken.

Claim: Sparta super kicked ass (page 7)

Bret Devereaux spent a long time debunking this and I spent a somewhat shorter time checking his work (it passed). Carlin also repeatedly says “Spartan” when he means “Spartan ruling class”, which is a common mistake but I think a revealing one.

Okay, I have finished chapter 1, which is seven pages long. It is titled “Do Tough Times Make for Tougher People?”, a reference to this meme:

I do not know if Carlin thinks tough times create tougher people. If you put a gun to my head I would say “Probably, except for if literally anything else is involved, perhaps?”  I do not know how he defines toughness. This is dumb. Toughness is easy to define, he shouldn’t have to spell it out, and yet I’m rereading the pages trying to figure out a coherent definition that makes sense and is meaningful all the way through. I feel fuzzy and slippery and then angry that I feel that way.

Contrast that with Devereaux’s 6 part series, The Fremen Mirage, which addresses the same question. Devereaux takes a strong stance (“no they fucking don’t”) and spends only two paragraphs before defining exactly the argument he is making. Then he spends a while complaining about people who cite “…weak men create times…” without strict definitions. 

Devereaux’s Fremen Mirage is full of claims that are both load-bearing (as in, if they were wrong, the argument would collapse) and capable of being resolved one way or the other. It’s tractable to check his work and come to a conclusion. Meanwhile, I did write down some claims from chapter one of The End… but… none of them matter? Of the things that could be called cruxes, they’re all vague and would at best take a lot of work to develop an informed opinion on. But I think that’s optimistic, and most of them are not actually provable or disprovable in a meaningful way.

So there you go. The End is Always Near was not even tractable enough to be worth checking.

Thanks to Miranda Dixon-Luinenburg, Justis Mills, and Daniel Filan for copyediting. Patreon patrons you’re off the hook for this one since it was so short.

Review: Martyr Made Podcast

Update (2022-11-01): I stand by what I said about Darry Cooper’s long-form history podcasts but his stuff on current events has gotten increasingly deranged, well beyond what even Twitter can justify.

Introduction

Sometimes I consume media that makes factual claims. Sometimes I look up some of these claims to see how much trust I should place in said media, in a series I call epistemic spot checks. Over the years, I’ve gone back and forth on how useful this is. Focusing on evaluating particular works instead of developing a holistic opinion on an entire subject does feel perverse to me. OTOH, sometimes non-fiction is recreational, and I don’t think having some of my attention directed by people I find insightful and trustworthy is a bad thing, as long as I don’t swallow their views unquestioningly. Additionally, there’s a pleasant orderliness to doing ESCs, like the intellectual equivalent of cleaning my house. It’s not enough in and of itself, but it can free up RAM such that there’s room for deeper work.

I started listening to Darryl Cooper’s Martyr Made last year as part of a deep dive on cults, but kept going because I found him incredibly insightful. After listening to the 30+ hours of the God’s Socialist sequence, I Googled around and found a few accusations of racism against Cooper. I didn’t believe the accusations then, and I still don’t. People can go through the motions of saying what other people tell them to, but they can’t fake what Cooper does, which is to approach every human being as someone worthy of respect and compassion, whose actions are probably reasonable given their incentives. I value that a lot more than proper signaling.

Some time later I found an archive of Cooper’s deleted Twitter logs, and, uh, I get where people are coming from on the racism thing. I still absolutely believe in his respect and compassion for everyone except members of the USSR leadership (and even then, he’ll say very nice things about the intentions of early communists).  However, the thing about doing that genuinely instead of choosing a side and signaling allegiance is that it doesn’t compress well to 140 characters, and he said a bunch of things that were extremely easy to round to terrible beliefs. I might also have mistaken him for racist, if all I had was his Twitter. But given the podcasts, I am very sure that he respects-and-has-compassion-for every human being.

[Between when I started listening and when I published this Cooper returned to Twitter, which I have mixed feelings about. Namely “I think this is bad for him intellectually and emotionally” vs. “He’s talking to me! Hurray!”]

I’m not a big fan of emotion in my history podcasts. Martyr Made is an exception. Cooper goes hours out of his way to make sure you understand how something felt, without ever coming across as dishonest or manipulative. Some of that is that he often uses himself as an example and is very upfront about his flaws. Some of that is the aforementioned respect and compassion seeping into everything he does. Some is good writing. 

For example, God’s Socialist is nominally about Jim Jones and the Jonestown massacre, but Cooper doesn’t believe Jonestown makes any sense unless you understand the 60s, hippies, the Civil Rights movement, and the Black Power movement. The prologue consists of a description of various race riots/race wars, the contemporary and just-pre-Civil-Rights-movements, and easily 15 minutes on his interactions with some homeless people in his neighborhood. For the last of these, he observes that though he’s occasionally kind, he mostly just ignores the individuals in question, and that sometimes he thinks that on Judgement Day the only thing that’s going to matter is how he failed to really help those men- whatever he did, it was for the wrong motives and much too little. I wrote a bunch of angry notes about how virtue ethics was bullshit while listening to this part, but by the end it became clear that he wasn’t making a call to any particular action, it was just an honest accounting of suffering in the world. He was walking me through it because he felt it was necessary to understand Jim Jones, whose first acts as an adult were taking care of people most of society was stepping over. 

All of this is to say: Martyr Made is one of my favorite pieces of nonfiction in the world. I’ve learned so much from it both factually and emotionally, but I felt vulnerable talking about that until I was absolutely rock solid on the author’s epistemics. I finally had time to do an epistemic spot check on the start of God’s Socialist (still my favorite sequence in the series), and I’m extremely relieved to announce that he nailed it, although just like my ESC of Acoup, it is not so amazingly perfect that the follow up wasn’t worth doing (and I assume Cooper would agree with that, just like Bret Devereaux did).

A word on ESCs: there’s a range of things it can mean to check someone’s epistemics. Sometimes it means checking their simple concrete facts. You would be amazed how many problems this catches. Another is to check leaps of logic: they can have their facts right but draw wildly incorrect inferences from them. Finding these requires more cognition, but is also fairly easy. Cooper did great on both of these, which was not surprising. My concern was always that his facts were literally true but unrepresentative. Accurate-in-spirit representation is one of the hardest things to judge, especially about really contentious issues like racial violence where second opinions are just another thing to fact check. What I can say is that everything I checked I was either able to concretely verify, or was extremely consistent with what I was able to find but was open to other interpretations, because it’s a contentious area with motivated record keeping.

The God’s Socialist sequence of Martyr Made is 30 hours long. I have ESCed the prologue, which is 90 minutes long, and some especially load-bearing claims I remembered from later in the podcast. I also happen to have already read one of Cooper’s most quoted sources, The Warmth of Other Suns (affiliate link), back in 2014. 2014 is a long time ago and I didn’t ESC Warmth at the time, but what Cooper quoted was generally in accordance with my memory of it, on both a factual and model level.

Without further adieu…

The Claims

Claim: A 2007 report from the Southern Poverty Law Center on Latino-on-Black violence in Los Angeles (1:02)

He reads this report very nearly word for word. All the differences I caught were very minor wording issues that didn’t change the meaning. I also checked some of SPLC’s claims

SPLC: “Since 1990, the African-American population of Los Angeles has dropped by half as blacks relocated to suburbs”, “Now, about 75% of Highland Park residents are Latinos. Only 2% are black. The rest are white and Asian.”  (8:17)

This was shockingly annoying to verify because I could find stats by year for LA county but not LA the city, and the county includes the suburbs. I did verify that:

  • In 2000 (seven years before the SPLC report came out), Highland Park was 72.4% Latino and 2.4% black (source).
    • Note that if you read the Wikipedia article it says 8.4% black, but it cites my source above. This is plausibly an issue of how to assign mixed-race people (since Wikipedia’s percentages add up to >100%), or the ongoing confusion about how Latino is an ethnicity, not a race.
    • However, that particular neighborhood was already 2.2% black in 1990, although it was a little whiter and less Latino (source).
  • An LA time article also describes South LA shifting from an approximately 1:1 ratio of Latino and Black residents to 2:1 (Highland Park is in northeast LA).

Claim: A number of specific incidents of Latino-on-Black violence in Los Angeles, and some nebulous statistics

I Googled several of these as they came up and they always checked out, although LA’s a big city and Cooper is looking over a long time period, so it would be easy to cherry pick.

Cooper also gave some statistics on hate crime. However, these were always either for a particular neighborhood (too small, data liable to be noisy), or not quite as damning as his tone suggested they were. I found some statistics that came out the same year this episode did that support the general concept that Latino-on-Black violence happens, but I don’t trust the LAPD’s truthseeking on hate crimes. 

Which is to say, Cooper’s claims are well sourced and completely consistent with the available data, but the data is poor and his opinions are more controversial than he acknowledges. I’m sure someone with different motivations could use the same data to make the opposite case, or a different one entirely. Here’s an article published the same year as the SPLC report, calling the claims ridiculous. My tentative take on this is that racial tensions were high and spilling over into violence, but the claims that “all black people in LA were greenlit” (meaning, gang members had the okay from leaders to shoot them) and “all black people in Latino neighborhoods in LA were greenlit” are clearly insane; the murder rate would be much higher if that were true. 

Claim: Quote from Warmth of Other Suns: “In 1950, city aldermen and housing officials proposed restricting 13,000 new public housing units to people who had lived in Chicago for two years. The rule would presumably affect colored migrants and foreign immigrants alike. But it was the colored people who were having the most trouble finding housing and most likely to seek out such an alternative.” (23:00)

This quote is accurate, but my memory of it wasn’t: I had in my notes that this proposal was enacted, and only rechecked the recording when I couldn’t find any such record and wanted to see if he cited a source. His source, Warmth of Other Suns, cites a 1950 newspaper article that I couldn’t find online (it probably exists in ProQuest’s Historical Newspaper archive, but I lack access despite trying ProQuest via multiple libraries).

Claim: Description of the Cicero Riots of 1951 (31:00)

Everything he says is in accordance with the Wikipedia article: it was a horrific multi-day riot and lynching episode triggered by a black family moving into a white neighborhood. 

Cooper doesn’t mention this, but fun fact: according to Wikipedia, the landlord allowed the family to move in not for any noble anti-racism or even free-market motivations, but to punish the neighborhood for fining her for something else. 

Claim: Southern white people did not want black people to leave during the Great Migration, because they needed them as labor (35:00)

Warmth of Other Suns says the same, although that’s not independent confirmation because it’s at least one of Cooper’s sources as well. Wikipedia agrees.

Claim: Northern union leaders were resistant to black migrants because they reduced labor’s power (43:00)

I could not find a smoking gun on this, which makes sense because labor is not going to want to admit it. However I found a number of articles, modern and contemporary, on companies bringing in black workers from the south as strikebreakers, and it would be extremely weird if that didn’t upset union leaders. 

Claim: Jim Jones began as a dynamic and promising civil rights movement leader, branched out into communism (1:05:20)

Yup.

Claim: Jonestown residents were mostly poor and black, and disproportionately children (1:17:00)

Yup and yup.

Note that this was not true of the leadership of Jonestown, which was overwhelmingly white. Cooper gets into this later in the sequence.

Claim: Jim Jones led successful efforts to integrate businesses in Indianapolis (memory)

This claim came later in the sequence. It and the similar claim below were very significant to me and a number of changes in my own models rest on them, so I expanded the scope of the project to include them.

There are many sources repeating this claim, including Wikipedia, some book, and r/HistoryAnecdotes, and none denying it. I am a little suspicious because everyone seems to agree on exactly how many restaurants he integrated, but no one names them. They do name a hospital, but it seems like maybe “integrated” means “he accidentally got assigned to a black ward (because his doctor was black) and refused to leave”. But it’s not surprising that restaurants he integrated either no longer exist or don’t want to be remembered as “the place that excluded minorities until forced to change by the guy who later led America’s largest simultaneous suicide”.

Claim: Jim Jones helped members of his racially-integrated church tremendously (memory)

I found many secondary or tertiary sources saying this and no arguments against, but the only primary sources I could find joined the church in California. I couldn’t find any reports from people who joined while the church was in Indiana. That doesn’t seem damning to me; it’s kinda hard to tell people your lights got turned back on by Jim Jones before he was famous. This interview with a woman who joined in California and narrowly escaped the mass suicide confirms everything it can: she was a true believer in a bunch of good things but also kind of a joiner who ping-ponged between organizations until she found peace with People’s Temple. Another CA joiner talks about joining because her sister needed a rehab program and was recommended to People’s Temple’s program. 

Claim: Jim Jones adopted multiple children of color (memory)

True. The Jones family adopted three Korean children, one part-Native American child, and one black child, who they named James Jones Jr (they also had one biological child and adopted a white child from a People’s Temple member. There are also some People’s Temple kids of unclear paternity).

I recognize that transracial adoption is contentious and actions that were considered progressive and inclusive 60 years ago are now viewed as bad for the children they were supposed to benefit. I also get that lots of adoptive white parents were unprepared to deal with the realities of racism, or harbor it themselves, and that harmed their kids. The whole mass suicide thing casts some doubt on Jim Jones as a parent too. Nonetheless, a white man naming his black son after himself in 1961 was an extraordinarily big deal for which he undoubtedly paid a very high price, and from all this I have to conclude that fighting racism was extremely important to early Jim Jones.

Summary

Overall all of the claims were at least extremely defensible. I wish Cooper acknowledged more of the controversy around his interpretations, but I also appreciate that he comes to actual conclusions with models instead of spewing a bunch of isolated facts. I also wish he provided show notes with citations, because he’s inconsistent about providing sources in the audio.

Doing this check reinforced my belief that having one source for any of your beliefs is malpractice and processing multiple sources is a requirement, however I will very happily continue to have Cooper as a significant source of information, and if I’m totally honest I’m not even going to check all his work this extensively. 

Thanks to Eli Tyre for research assistance, my Patreon Patrons for financial support of this post, and Justis Mills for editing.

The Oil Crisis of 1973

Last month I investigated commonalities between recessions of the last 50 years or so. But of course this recession will be different, because (among other things) we will simultaneously have a labor shortage and a lot of people out of work. That’s really weird, and there’s almost no historical precedent- the 1918 pandemic took place during a war, and neither 1957 nor 1968 left enough of an impression to have a single book dedicated to them.

So I expanded out from pandemics, and started looking for recessions that were caused by any kind of exogenous shock. The best one I found was the 1973 Oil Crisis. That was kicked off by Arab nations refusing to ship oil to allies who had assisted Israel during the Yom Kippur war- as close as you can get to an economic impact without an economic cause. I started to investigate the 1973 crisis as the one example I could find of a recession caused by a sudden decrease in a basic component of production, for reasons other than economic games.

Spoiler alert: that recession was not caused by a sudden decrease in a basic component of production either.

Why am I so sure of this? Here’s a short list of little things,


But here’s the big one: we measure the price of oil in USD. That’s understandable, since oil sales are legally required to be denominated in dollars. But the US dollar underwent a massive overhaul in 1971, when America decided it was tired of some parts of the Bretton Woods Agreement. Previously, the US, Japan, Canada, Australia and many European countries maintained peg (set exchange rate)  between all other currencies and USD, which was itself pegged to gold. In 1971 the US decided not to bother with the gold part anymore, causing other countries to break their peg. I’m sure why we did this is also an interesting story, but I haven’t dug into it yet, because what came after 1971 is interesting enough.  The currency of several countries appreciated noticeably (Germany, Switzerland, Japan, France, Belgium, Holland, and Sweden)…


(I apologize for the inconsistent axes, they’re the best I could do)


…but as I keep harping on, oil prices were denominated in dollars. This meant that oil producing countries, from their own perspective, were constantly taking a pay cut. Denominated in USD, 1/1/74 saw a huge increase in the price of oil. Denominated in gold, 1/1/74 saw a return to the historic average after an unprecedented low.


(apologies for these axes too- the spike in this graph means oil was was worth less, because you could buy more with the same amount of gold)


This is a little confusing, so here’s a timeline:

  • 1956: Failed attempt at oil embargo
  • 1967: Failed attempt at oil embargo
  • 1971, August: US leaves the gold standard
  • 1972: Oil prices begin to fall, relative to gold
  • 1972, December: US food prices begin to increase the rate of price increases.
  • 1973, January: US Stock market begins 2-year crash
  • 1973, August: US food prices begin to go up *really* fast
  • 1973, October, 6: Several nearby countries invade Israel
  • 1973, October, 17: Several Arab oil producing countries declare an embargo against Israeli allies, and a production decrease. Price of oil goes up a little (in USD).
  • 1974, January, 1: Effective date of declared price increase from $5.12 to $11.65/barrel. Oil returns to historically normal price measured in gold.

This is not the timeline you’d expect to see if the Yom Kippur war caused a supply shock in oil, leading to a recession.

My best guess is that something was going wrong in the US and world economy well before 1971, but the market was not being allowed to adjust. Breaking Bretton Woods took the finger out of the dyke and everything fluctuated wildly for a few years until the world reached a new equilibrium (including some new and different economic games).The Yom Kippur war was a catalyst or excuse for raising the price of oil, but not the cause.


Thanks to my Patreon subscribers for funding this research, and several reviewers for checking my research and writing.


Epistemic (Spot Check?): The Fate of Rome Round 2

Introduction

Two months ago I did an epistemic spot check on Kyle Harper’s The Fate of Rome. At the time I found only a minor flaw- stating that Roman ships weren’t surpassed until the 14th century, when China did it in the 13th century. I did not consider this fatal by any means.

Recently I decided to reread The Fate of Rome (affiliate link). This was driven by a few things. Primarily, I found myself resistant to reading more Roman history, which typically means I’m holding things in my short-term memory and will not be allowed to put new things into my brain until the existing things have been put in long term storage. But it did not hurt at all that I had just gotten access to a new exobrain, Roam, a workflowy/wiki hybrid, and yes, for purposes of this post that is an extremely unfortunate name.

This post is going to wear many hats: a second check of The Fate of Rome, a log of my work improving the epistemic spot check process, and a discussion of how Roam has affected my work. These will not be equally interesting to all people but I couldn’t write it any other way. That said, let us begin.

Process

Previously, I’d “taken notes” by highlighting passages and occasionally writing notes in the Kindle file, and then never reading them because Amazon’s anti-consumer choices made them a pain to access. Worse, I used highlights as an excuse not to take information into my brain- it was a pointer to process something later, not a reminder of something I had already processed.

When I took notes in Roam, I took notes. My initial workflow was to create a page for the book I was reading, and on it list claims from the book, each of which got their own page (I would eventually change that and leave them as bullet points on the source page). You can see the eventual result here: typically I recorded multiple claims per source-page, mostly rephrased into my own words, and always thought through instead of saved for thinking about later. (For comparison: notes from Fall of Rome round 1).

A few changes started about this time:

  • I stopped being able to read without taking notes on my laptop, meaning I could no longer use my Kindle. I don’t think I got worse at reading on Kindle, it just became obvious how bad that always was.
  • Despite having to use a multi-purpose device, I was more focused and harder to distract, probably by an order of magnitude.
  • I couldn’t work on the project passed ~9PM. I don’t think I was ever doing my best work past 9, it just became obvious in contrast to the better work I could now do.
  • I wanted to put a timestamp on every claim, so I noticed when it was unclear what time period a statement referred to.
  • “How do we know that?” questions moved from something I pushed myself to think about during second read-throughs to popping into my head unbidden. There were just natural “How do we know that?” shaped holes in my notes.
  • It became much more obvious when a bunch of paragraphs said nothing, or said nothing I valued, because even when I tried I couldn’t distill them into my notes.
  • Reading books felt like play in a way it never had before, even though it was always something I enjoyed doing.
  • I got more proactive about housecleaning. No, I wasn’t using Roam as a GTD system, it was purely research notes. And yet, I had more activation energy and more willingness to do multi-step chores. I have logs from Toggl to demonstrate this correlation, if not causation. Even assuming it’s causal I’d be shocked if it were common, so you probably shouldn’t incorporate it into your expected value of trying Roam.

At this stage the workflow is nothing I couldn’t have done in google docs, but I didn’t. I have all kinds of justifications about how knowing what I could do with Roam changed how I approached the work, but when I started that was theoretical so I’m not confident that’s what was going on. Nonetheless, I did it in Roam where I didn’t in Docs. 

So I had a Source page and a bunch of Claim pages. I started to do what I used to do in google docs or even a wordpress draft: select a claim and look for things confirming or denying it. This meant putting evidence on the Claims pages. But that didn’t feel right- why should some sources get their own page when others sat on the pages of claims from other sources? So I let claims motivate my choice of sources to look up, but every source got its own page with its claims listed on it. When I felt I knew enough I would create a Synthesis page representing what I really thought, with links to all the relevant claims (Roam lets you link to bullet points, not just pages) and a slider bar stating how firmly I believed it. This supported something I already wanted conceptually, which was shifting from [evaluating claims for truth and then judging the trustworthiness of the book] to [collating data from multiple sources of unknown reliability to inform my opinion of the world]. When this happened it became obvious Claims didn’t need their own pages and could live happily as bullet points on their associated Source page.

Once I had a Synthesis I would back-propagate a Credence to the claim that inspired the thread. Ideally I would have back propagated to all relevant claims, but that was more effort than it was worth. I put credences right in the claim so they would automatically show up when linked to, giving me a quick visual on how credible the book’s claims were when I investigated. The visual isn’t perfect because claims can have wildly different weights, but it is a start.

[Due to a bug, slider bars can be changed even by people given only read-access, so I also put the Credence in text]

Results

It turns out that The Fate of Rome was a near-ideal book about which to start asking “how do we know this?” (or maybe I’ll do more books and find out it’s average, but it definitely rewarded the behavior), because it is working with cutting edge science to prove its points, meaning it’s doing a lot of interpretation.

The Fate of Rome makes two big claims: Rome’s peak coincides with a period of unusually favorable and stable weather in the Mediterranean (from 200 BC to 150 AD), and Rome was a constant disease fest punctuated by peaks of even more illness.  What I would like to do right now is link you to my Fate of Rome Roam page, tell you to look at the links at the bottom, filter for Synthesis, and just browse through my work. It’s better prepared than I could ever do linearly, and lets you choose which parts are important to you. But I suspect there’s a learning curve to Roam so I will write things out the tedious linear way.

The Fate of Rome lists many sources of data on ancient climate. Here is a list of what I consider the 5 strongest, and the time period they supposedly applied. If you were reading this on Roam, you would have page numbers so you could verify my interpretation:

  • Cosmogenic radionuclides in ice cores say that 360BC – 690 AD had unusually stable solar activity
  • (Source unknown) says no major volcanic eruptions between “late republic” (end of the BCs) and “age of Justinian” (530s)
  • Ratio of Oxygen18 to Oxygen16 in stalagmites points to warmth during “early Imperial Rome”
  • The Tiber River flooded regularly (source unknown) during peak Imperial Rome
  • Radiocarbon-dated sediments say the Dead Sea was at a peak from 200 BC to 200 AD

I have three complaints here: he doesn’t share the resolution of each method, two of the data points are unsourced (although one points to a paper where I could have looked it up), and these time periods don’t match up particularly well. For the first: I tried to find the resolution for ice cores at a depth of 2000 years, and was unable to come to a definitive answer, but I did find a suggestion that they’re extremely sensitive to the assumptions in your model, which makes me nervous. The third thing seems even more concerning: if anything it seems like the good times should have rolled through the collapse of the western empire, not ended at 150AD like Fate suggests. When you add in the innate political nature of any claims about changing climate, I’m inclined to view Fate’s climate claims as speculative, although not impossible. 

Another question Fate raises is the baseline health of the Romans. I think Fate is correct that it was terrible, and that’s an update for me. Turns out communal baths are not a source of hygiene before chlorine. Harper claims the disease and parasite load was worse than the people on the same land before or after. I initially thought this seemed reasonable for “before” but unreasonable for “after”- medieval peasants had shockingly terrible diets and disease risks. But if anything the evidence supports the opposite of what I thought– you have to go pretty far back to find people much taller than the Romans, but height jumps just as the (western) empire falls. There are other explanations for this, around exactly which skeletons get found, but basically all the sources I found agreed that the Roman disease load was high.

I’m not without qualms though. A prime piece of evidence he uses to demonstrate a high disease load is dental caries (cavities) versus Linear Enamel Hypoplasia, a defect in the growth of a tooth. Medieval peasants had more caries than Romans but less LEH. Harper’s interpretation is that medieval peasants had worse diets than Romans (because the caries indicate high carb content) but less disease (LEH can be caused by both poor nutrition and disease, and a better diet is indicated by the lack of caries). Martin Bernstorff, a friendly medical student who I met on Roam Slack, helped me out on this one. Based on a half hour of his research, an equally plausible explanation is that medieval peasants had the same disease load but more calcium. This doesn’t mean Rome wasn’t terrible- medieval European peasants had it shockingly bad. But it is not clear cut evidence of Rome being worse.

A sub-claim is that the Antonine Plague (165AD-180AD) was caused by Smallpox. Harper is careful to say that retrospective diagnosis is difficult without biochemical evidence and there’s not actually a lot riding on this conclusion: he’s not doing epidemiological modeling dependent on properties of smallpox in particular, for example. But he does sound very confident, and I wanted to see if that was justified. Martin took a look at this one too, and concluded there was a 95% chance Harper was correct, assuming the Roman doctor’s notes were accurate. The remaining 5% covers the chance of a related pox virus with a lower mortality rate.

Overall I still like The Fate of Rome, but I have much less trust in it than I did after my first spot check, when its only sin was briefly forgetting China existed. It its fight with The Fall of Rome, it has lost ground.


More Process

My first try at Fate took an unrecorded number of hours to read, and ~two hours to spot check (this is shorter than usual, because of the amplification experiment) Call it < 10 hours, not counting the time to write it up. This round took 17 hours of combined reading and investigation into claims  (plus 1.5 hours of Martin’s time), and so far three hours to write it up. This isn’t an apples-to-apples comparison, but that’s not *that much* additional time, for the increase in depth and understanding I got. I credit Roam with speeding things up enormously.

Since this is partially a love letter to Roam, I want to add a few things: 

  • Over the years I’ve tried workflowy, calculist, and google docs. I did not go looking for other tools in this space and don’t intend to because I am Roam’s exact use case, so even if it’s not the best now I expect it grow towards me.
  • It’s just into beta and it shows: I probably file a bug or feature request per day. It’s never anything that renders Roam unusable, just things take longer than they should. 
  • Roam’s CEO, Conor White-Sullivan, has encouraged me to share my experience but has not given me anything for this post except a good product and the hope that it will continue to exist if enough people use it. 


As always, tremendous thanks to my Patreon patrons for their support. I would additionally like to thank Martin Bernstorff for his research (check out his new blog) and Edo Arad for comments on a draft.

Epistemic Spot Checks: The Fall of Rome

Introduction

Epistemic spot checks are a series in which I select claims from the first few chapters of a book and investigate them for accuracy, to determine if a book is worth my time. This month’s subject is The Fall of Rome, by Bryan Ward-Perkins, which advocates for the view that Rome fell, and it was probably a military problem.

Like August’s The Fate of Rome, this spot check was done as part of a collaboration with Parallel Forecasting and Foretold, which means that instead of resolving a claim as true or false, I give a confidence distribution of what I think I would answer if I spent 10 hours on the question (in reality I spent 10-45 minutes per question). Sometimes the claim is a question with a numerical answer, sometimes it is just a statement and I state how likely I think the statement is to be true.

This spot check is subject to the same constraints as The Fate of Rome, including:

  1. Some of my answers include research from the forecasters, not just my own.
  2. Due to our procedure for choosing questions, I didn’t investigate all the claims I would have liked to.

Claims

Claim made by the text:  “[Emperor Valerian] spent the final years of his life as a captive at the Persian Court”
Question I answered: what is the chance that is true?
My answer: I estimate a chance of (99 – 3*lognormal(0,1)) that Emperor Valerian was captured by the Persians and spent multiple years as a prisoner before dying in captivity.

You don’t even have to click on the Wikipedia page to confirm this is the common story: it’s in the google preview for “emperor valerian”. So the only question is the chance that all of history got this wrong. Wikipedia lists five primary sources, of which I verified three.  https://www.ancient-origins.net/history/what-really-happened-valerian-was-roman-emperor-humiliated-and-skinned-hands-enemy-008598 raises questions about how badly Valerian was treated, but not that he was captive.

My only qualm is the chance that this could be a lie perpetuated at the time. Maybe Valerian died and the Persians used a double, maybe something weirder happened. System 2 says the chance of this is < 10% but gut says < 15%.


Claim made by the text: “What had totally disappeared, however, were the good-quality, low-value items, made in bulk, and available so widely in the Roman period”
Question I answered: What is the chance mass-produced, low-value items available so widely in the Roman period, disappear in Britain by 600 AD?
My answer: I estimate a chance of (64 to 93, normal distribution) that mass-produced, low-value items were available in Britain during Roman rule and not after 600 AD.

This was one of the hardest claims to investigate, because it represents original research by Ward-Perkins. I had basically given up on answering this without a pottery PhD until google suggestions gave me the perfect article.

This is actually a compound claim by Ward-Perkins: 

  1. Roman coinage and mass-produced, low-cost, high-quality pottery disappeared from Britain and then the rest of post-Roman Europe.
  2. The state of pottery and coinage is a good proxy for the state of goods and trades as a whole, because they preserve so amazingly well and are relatively easy to date.

Data points:

    • Focuses on how amphorae were never really abundant in Britain
    • Chart stops at 400 AD
    • Graph showing large drops in amphorae distribution by 410 AD

If we believe Ward-Perkins and Brewminate, I estimate the chances that pottery massively declined at 95-99,  times 80-95 that other good declined with them. There remains the chances that the historical record is massively misleading (very unlikely with pots, although I don’t know how likely it is to have missed sites entirely), and that W-P et al are misinterpreting the record. I would be very surprised if so many sites had been missed as to invalidate this data, call it 5-15%. Gut feeling, 5-20% chance the W-P crowd are exaggerating the data, but given the absence of challenges, not higher than that and not a significant chance they’re just making shit up.

(95 to 99)*(85 to 95) * (80 to 95) = 64 to 93%


Claim made by the text: The Romans had mass literacy, which declined during the Dark Ages.
Question I answered: “[% population able to read at American 1st grade level during Imperial Rome] – [% population able to do same in the same geographic area in 1000 AD] = N%. What is N?”
My answer: I estimate that there is a 95% chance [Roman literacy] – [Dark Ages literacy] = (0 to 60, normal distribution) 

Data Points:


The highest estimate of literacy in Roman Empire I found is 30%.  Call it twice that for ability to read at a 1st grade level in cities. So the range is 5%-60%. 

The absolute lowest the European 1000AD literacy rate could be is 0; the highest estimate is 5% (and that was in the 1300s, which were probably more literate).  From the absence of graffiti I infer that even minimal literacy achievement dropped a great deal. 

Maximum = 60%-1% = 59%
Minimum = 5%-5%=0


Claim made by the text: “What some people describe as “the invasion of Rome by Germanic barbarians”, Walter Goffart describes as “the Romans incorporating the Germanic tribes into their citizenry and setting them up as rulers who reported to the empire.” and “Rome did fall, but only because it had voluntarily delegated its own power, not because it had been successfully invaded”.”
Question I answered: What is my confidence that this accurately represents historian Walter Goffart’s views?
My answer: I estimate that after 10 hours of research, I would be 68-92% confident this describes Goffart’s views accurately.

Data points:

  • https://blog.oup.com/2005/12/the_fall_of_rom/
    • Peter Heather: The most influential statement of this, perhaps, is Walter Goffart’s brilliant aphorism that the fall of the Western Empire was just ‘an imaginative experiment that got a little out of hand’. Goffart means that changes in Roman policy towards the barbarians led to the emergence of the successor states, dependant on barbarian military power and incorporating Roman institutions, and that the process which brought this out was not a particularly violent one.
  • https://www.goodreads.com/book/show/1680215.Barbarians_and_Romans_A_D_418_584?from_search=true 
    • Despite intermittent turbulence and destruction, much of the Roman West came under barbarian control in an orderly fashion.”
  • https://press.princeton.edu/titles/1036.html
    • Despite intermittent turbulence and destruction, much of the Roman West came under barbarian control in an orderly fashion. Goths, Burgundians, and other aliens were accommodated within the provinces without disrupting the settled population or overturning the patterns of landownership. Walter Goffart examines these arrangements and shows that they were based on the procedures of Roman taxation, rather than on those of military billeting (the so-called hospitalitas system), as has long been thought. Resident proprietors could be left in undisturbed possession of their lands because the proceeds of taxation,rather than land itself, were awarded to the barbarian troops and their leaders.”
  • https://onlinelibrary.wiley.com/doi/abs/10.1111/j.1478-0542.2008.00523.x
    • “the barbarians and Rome, instead of being in constant conflict with each other, occupied a joined space, a single world in which both were entitled to share. What we call the barbarian invasions was primarily a drawing of foreigners into Roman service, a process sponsored, encouraged, and rewarded by Rome. Simultaneously, the Romans energetically upheld their supremacy. Many barbarian peoples were suppressed and vanished; the survivors were persuaded and learned to shoulder Roman tasks. Rome was never discredited or repudiated. The future endorsed and carried forward what the Empire stood for in religion, law, administration, literacy, and language.”
  • https://books.google.com/books/about/Rome_s_Fall_and_After.html?id=55pDIwvWnpoC “Rome’s Fall and After” indicates Goffat does believe Rome fell. But suggests its main problem was constantinople, not interactions with barbarians at all. So top percentage correct = 90%)


This seems pretty conclusive that Goffart thought Barbarians were accommodated rather than conquered the area (so my minimum estimate that the summary was correct must be greater than 50%). However it’s not clear how much power he thought they took, or whether rome fell at all. This could be a poor restatement, or it could be that if I read Goffart’s actual work and not just book jacket blurbs I’d agree.


Question I answered: Chance Elizabeth would recommend this book as a reliable source on the topic to an interested friend, if they asked tomorrow (8/31/19)?
My answer: There is a (91-99%, normal distribution) chance I would recommend this to a friend.

99% is in range, because I definitely think it’s worth reading if they’re interested in the topic. I think I’d recommend it before Fate of Rome, because it establishes that rome fell more concretely.

Is there a chance I wouldn’t recommend it?

  • They could have already read it
  • They could be more interested in disease and climate change (in which case I’d recommend Fate)
  • I could forget about it
  • I could not want to take responsibility for their reading.
  • I could be unconfident that Fall was better than what they’d find by chance.
    • This feels like the biggest one.
    • But the question doesn’t say “best book”, it just says “reliable source”
    • Only real qualm on that is that is normal history book qualms

So the minimum is 91%


Bonus Claims

These are the claims I didn’t check, but other people made predictions on how I would guess. Note that at this point the predictions haven’t been very accurate- whether they’re net positive depends on how you weight the questions. And Foretold is beta software that hasn’t prioritized export yet, so I’m using *shudder* screen shots. But for the sake of completeness:

Claim made by the text: The Fall of Rome: Roman Pottery pre-400AD was high quality and uniform.
Predicted answer: 29.9% to 63.5% chance this claim is correct

Claim made by the text: “In Britain new coins ceased to reach the island, except in tiny quantities, at the beginning of the fifth century”
Predicted answer: 31.6% to 94% chance this claim is correct


Claim made by the text: The Fall of Rome: [average German soldiers’ height] – [average Roman soldiers’ height] = N feet. What is N? .
Predicted answer: -0.107 to 0.61 ft.


Claim made by the text: The Romans chose to cede local control of Gaul to the Germanic tribes in the 400s, as opposed to losing them in a military conquest.
Predicted answer: 28.5% to 85.6% chance this claim is correct


Claim made by the text: The Germanic tribes who took over local control of Gaul in the 400s reported to the Emperor.
Predicted answer: 4.77% to 50.9% chance this claim is correct


Conclusion

The Fall of Rome did very well on spot-checking- no outright disagreements at all, just some uncertainties. 

On the other hand, The Fall of Rome barely mentions disease and doesn’t mention climate change at all, which my previous book, The Fate of Rome, claimed to be the main causes of the fall. The Fate of Rome did almost as well in epistemic spot checking as Fall, yet they can’t both be correct. What’s going on? I’m going to address that in a separate post, because I want to be able to link to it without forcing people to read this entire spot check.

In terms of readability, Fall starts slowly but the second half is by far the most interested I have ever been in pottery or archeology.

[Many thanks to my Patreon patrons and Parallel Forecast for financial support for this post]

Does combining epistemic spot checks and prediction markets sound super fun to you? Good news: We’re launching round three of the experiment today, with prizes of up to $65/question. The focal book will be The Unbound Prometheus, by David S. Landes, on the Industrial Revolution. The market opens today and will remain open until 10/27 (inclusive).


Epistemic Spot Check: The Fate of Rome (Kyle Harper)

Introduction

Epistemic spot checks are a series in which I select claims from the first few chapters of a book and investigate them for accuracy, to determine if a book is worth my time. This month’s subject is The Fate of Rome, by Kyle Harper, which advocates for the view that Rome was done in by climate change and infectious diseases (which were exacerbated by climate change).

This check is a little different than the others, because it arose from a collaboration with some folks in the forecasting space. Instead of just reading and evaluating claims myself, I took claims from the book and made them into questions on a prediction market, for which several people made predictions of what my answer would be before I gave it. In some but not all cases I read their justifications (although not numeric estimates) before making my final judgement.

I expect we’ll publish a post-mortem on that entire process at some point, but for now I just want to publish the actual spot check. Because of the forecasting crossover, this spot check will differ from those that came before in the following ways:

  1. Claims are formatted as questions answerable with a probability. If a claim lacks a question mark, the implicit question is “what is the probability this is true?”.
  2. Questions have a range of specificity, to allow us to test what kind of ambiguities we can get away with (answer: less than I used).
  3. Some of my answers include research from the forecasters, not just my own.
  4. Due to timing issues, I finished the book and a second on the topic before I did the research for spot check.
  5. Due to our procedure for choosing questions, I didn’t investigate all the claims I would have liked to.


Claims

Original Claim: “Very little of Roman wealth was due to new technological discoveries, as opposed to diffusion of existing tech to new places, capital accumulation, and trade.”
Question: What percentage of Rome’s gains came from technological gains, as opposed to diffusion of technical advantages, capital accumulation, and trade?

1%-30% log distribution

Data:

  • The Fall of Rome talks extensively about how trade degraded when the Romans left and how that lowered the standard of living.
  • https://brilliantmaps.com/roman-empire-gdp/ shows huge differences in GDP by region, implying there was a big opportunity to grow GDP through trade and diffusion of existing tech. That means potential growth just from catch up growth was > 50%.
  • Wikipedia doesn’t even show growth in GDP per capita (with extremely wide error bars) from 14AD to 150AD.
  • Rome did have construction and military tech (https://en.wikipedia.org/wiki/Roman_technology)
  • It also seems likely that expansion created a kind of Dutch disease, in which capable, ambitious people were drawn to fighting and/or politics, and not discovering new tech.
  • One potential place where Roman technology could have contributed greatly to the economy was lowering disease via sanitation infrastructure. According to Fate of Rome and my own research, this didn’t happen; sanitation was not end to end and therefor you had all the problems inherent in city living.

Original Claim: “The blunt force of infectious disease was, by far, the overwhelming determinant of a mortality regime that weighed heavily on Roman demography”
Question: Even during the Republic and successful periods of the empire, disease burden was very high in cities.

60%-90% normal distribution

The wide spread and lack of inclusion of 100% in the confidence interval stem from the lack of precision in the question. What distinguishes “high” from “very high”, and are we counting diseases of malnutrition or just infectious ones? I expected to knock this one out in two minutes, but ended up feeling the current estimates of disease mortality lack the necessary precision to answer it.

Data:


Original Claim: “The main source of population growth in the Roman Empire was not a decline in mortality but, rather, elevated levels of fertility”
Question: When Imperial Rome’s population was growing, it was due to a decline in death rates, rather than elevated fertility.

80-100%, c – log distribution

“Elizabeth, that rephrase doesn’t look much like that original claim” you might be saying quietly to yourself. You are correct- I misread the claim in the book, at least twice, and didn’t catch it until this write-up. This isn’t as bad as it seems. The claims are not quite opposite, because my rephrase was trying to explain variation in growth within Rome, and the book was trying to explain absolute levels, or possibly the difference relative to today.

Back when he was doing biology, Richard Dawkins had a great answer to the common question “how much is X due to genetics, as opposed to environment?”. He said asking that is like asking how much of a rectangle’s area is due to its length, as opposed to its width. It’s a nonsensical question. But you assign proportionate responsibility for the change in area between two rectangles.

Fate‘s original claim was much like asking how much of a trait is due to genetics. This is bad and it should feel bad, but it’s a very common mistake, and I give Fate a lot of credit for providing the underlying facts such that I could translate it into the “what causes differences between things” question without even noticing.

Since weak framing wasn’t a systemic problem in the book and it presented the underlying facts well enough for me to form my own, correct, model, I’m not docking Fate very harshly on this one.

Original Claim: “The size of Roman merchant ships was not exceeded until the 15th century, and the grain ships were not surpassed until the 19th.”
Question: “The size of Roman merchant ships was not exceeded until the 15th century, and the grain ships were not surpassed until the 19th.”

0-10% log distribution.

This is true within the Mediterranean, but if  you check Chinese ships it’s obvious it’s off by at least 100 years, possibly more.

Original Claim: too diffuse to quote.
Question: The Roman Empire suffered greatly from intense epidemics, more so than did the Republic or 700-1000 AD Europe.

90-100% c – log distribution

https://en.wikipedia.org/wiki/List_of_epidemics shows a pretty clear presence of epidemics in the relevant period and absence in the others.


Original Claim: too diffuse to quote.
Question: Starvation was not a big concern in Imperial Rome’s prime.

80-100% c – log distribution

https://en.wikipedia.org/wiki/List_of_famines shows Roman famine in 441 BC (the Republic) and isolated famines from 370 on, but pretty much validates that during the prime empire, mass starvation was not a threat.

Conclusion:

My fact checking found two flaws:

  1. An inaccuracy in when ships that exceeded the size of Roman trade ships were built, and/or forgetting China was a thing. The inaccuracy does not invalidate the author’s point, which is that the Romans had better shipping technology than the cultures that followed them.
  2. Bad but extremely common framing for the relative effects of disease mortality vs. birth rates.

These is well within tolerances for things a book might get wrong. I’m happy I read this book, and would read another by the same author (with perhaps more care when it refers to happenings outside of Europe), but they are not jumping to the of my list.

Is The Fate of Rome correct in its thesis that Rome was brought down by climate change and disease? I don’t know. It certainly seems plausible, but is clearly advocating for a position rather than trying to present all the relevant facts. There are obvious political implications to Fate even if it doesn’t spell them out, so I would want to read at least one of the 80 million other books on the Fall of Rome before I developed an opinion. I’m told some people think it had to do with something military, which Fate barely deigns to mention. In the future I hope to be a good enough prediction-maker to put a range on this anyways, however wide it must be, but for now I’m succumbing to the siren song of “but you could just get more data”.

[Many thanks to my Patreon patrons and Parallel Forecast for financial support for this post]

PS. This book is the first step of an ongoing experiment with epistemic spot checks and prediction markets. If you would like to participate in or support these experiments, please e-mail me at elizabeth-at-this-domain-name. The next round is planned to start Saturday August 24th.

Review: The Dueling Neurosurgeons (Sam Kean)

If you like this blog, you might like…

I originally intended The Tale of the Dueling Neurosurgeons for epistemic spot checking, but it didn’t end up feeling necessary.  I know just enough neurobiology and psychology to recognize some of its statements as true without looking them up, and more were consistent enough with what I knew and what good science and good science writing looks like; interrogating the book didn’t seem worth the trouble.  I jumped straight to learning from it, and do not regret this choice.  The first thing I actually looked up came 20% of the way into the book, when the author claimed the facial injuries of WWI soldiers inspired the look of the Splicers from BioShock.*

[*This is true. He used the word generic mutant, not the game-specific term Splicer, but I count that under “acceptable simplifications for the masses”.  Also, he is quicker to point out that he is simplifying than any book I can remember.]

At this point it may be obvious why I think fans of this blog will really enjoy this book, beyond the fact that I enjoyed it.  It has a me-like mix of history (historical color, “how we learned this fact”, and “here’s this obviously stupid alternate explanation and why it looked just as plausible if not more so at the time”*), actual science at just the right level of depth, and fun asides like “a lot of data we’ve been talking in this chapter on phantom limbs about comes from the Civil War.  Would you like to know why there were so many lost limbs in the Civil War?  You would?  Well here’s two pages on the physics of rifles and bullets.”**

[*For example, the idea that the brain was at all differentiated was initially dismissed as phrenology 2.0.

**I’m just going to assume you want the answer: before casings were invented, rifles had a trade off between accuracy and ease of use.  Bullets that precisely fit the barrel are very hard to load, bullets smaller than the barrel can’t be aimed with any accuracy.  Some guy resolved this by creating bullets that expanded when shot.  But that required a softer metal, so when the bullet hit it splattered.  This does more damage and is much harder to remove.]

I am more and more convinced that at least through high school, teaching science independent of history of science is actively damaging, because it teaches scientific facts, and treating things as known facts damages the scientific mindset.  “Here is the Correct Thing please regurgitate it” is the opposite of science.  What I would really love to see in science classes is essentially historical reenactments.  For very young kids, give them the facts as we knew them in 18XX, a few competing explanations, and experiments with which to judge them (biased towards practical ones you know will give them informative results), but let them come to their own conclusions.  As they get older, abandon them earlier and earlier in the process; first let them create their own experiments, then their own hypotheses, and eventually their own topics.  Before you know it they’re in grad school.

The Dueling Neurosurgeons would be a terrible textbook for the lab portion of that class because school districts are really touchy about inducing brain damage.  But scientists had a lot of difficulty getting good data on the brain for the exact same reason, and Dueling Neurosurgeons is an excellent representation of that difficulty.  How do we learn when the subject is immensely complex and experiments are straightjacketed?  I also really enjoyed the exploration of  the entanglement between what we know and how we know it.  I walked away from high school science feeling those were separable, but they’re not.

You might like this book if you:

  • like the style of this blog. In particular, entertaining asides that are related to the story but not the point. (These are mostly in footnotes so if you don’t like them you can ignore them).
  • are interested in neurology or neuropsychology at a layman’s level.
  • share my fascination with history of science.
  • appreciate authors who go out of their way to call out simplifications, without drowning the text in technicalities.

You probably won’t like this book if you:

  • need to learn something specific in a hurry.
  • are squeamish about graphic descriptions of traumatic brain damage.
  • are actually hoping to see neurosurgeons duel.  That takes up like half a chapter, and by the standards of scientists arguing it’s not very impressive.

The tail end of the book is either less interesting or more familiar to me, so if you find your interest flagging it’s safe to let go.

This post supported by patreon