There are a lot of vitamins and other supplements in the world, way more than I have time to investigate. Examine.com has a pretty good reputation for its reports on vitamins and supplements. It would be extremely convenient for me if this reputation was merited. So I asked Martin Bernstoff to spot check some of their reports.
We originally wanted a fairly thorough review of multiple Examine write-ups. Alas, Martin felt the press of grad school after two shallow reviews and had to step back. This is still enough to be useful so we wanted to share, but please keep in mind its limitations. And if you feel motivated to contribute checks of more articles, please reach out to me (elizabeth@acesounderglass.com).
My (Elizabeth’s) tentative conclusion is that it would take tens of hours to beat an Examine general write-up, but they are not complete in either their list of topics nor their investigation into individual topics. If a particular effect is important to you, you will still need to do your own research.

Write-Ups
Vitamin B12
Claim: “The actual rate of deficiency [of B12] is quite variable and it isn’t fully known what it is, but elderly persons (above 65), vegetarians, or those with digestion or intestinal complications are almost always at a higher risk than otherwise healthy and omnivorous youth”
Verdict: True but not well cited. Their citation merely asserts that these groups have shortages rather than providing measurements, but Martin found a meta-analysis making the same claim for vegetarians (the only group he looked for).
Toxicology
Verdict: Very brief. Couldn’t find much on my own. Seems reasonable.
Claim: “Vitamin B12 can be measured in the blood by serum B12 concentrations, which is reproducible and reliable but may not accurately reflect bodily vitamin B12 stores (as low B12 concentrations in plasma or vitamin B12 deficiencies do not always coexist in a reliable manner[19][26][27]) with a predictive value being reported to be as low as 22%”
Verdict: True, the positive predictive value was 22%, but with a negative predictive value of 100% at the chosen threshold. But that’s only the numbers at one threshold. To know whether this is good or bad, we’d have to get numbers at different threshold (or, preferably, a ROC-AUC).
Claim: B12 supplements can improve depression
Examine reviews a handful of observational studies showing a correlation, but includes no RCTs. This is in spite of there actually being RCTs like Koning et al. 2016 and a full meta analysis, neither of which find an effect.
The lack of effect in RCTs is less damning than it sounds. I (Elizabeth) haven’t checked all of the studies, but the Koning study didn’t confine itself to subjects with low B12 and only tested serum B12 at baseline, not after treatment. So they have ruled out neither “low B12 can cause depression, but so do a lot of other things” nor “B12 can work but they used the wrong form”.
I still find it concerning that Examine didn’t even mention the RCTs, and I don’t have any reason to believe their correlational studies are any better.
Interactions with pregnancy
Only one study on acute lymphoblastic leukemia. Seems a weird choice. Large meta-analyses exist for pre-term birth and low birth weight, likely much more important. Rogne et al. 2016.
Overall
They don’t seem to be saying much wrong but the write-up is not nearly as comprehensive as we had hoped. To give Examine its best shot, we decided the next vitamin should be on their best write-up. We tried asking Examine which article they are especially confident in. Unfortunately, whoever handles their public email address didn’t get the point after 3 emails, so Martin made his best guess.
Vitamin D
Upper respiratory tract infections.
They summarize several studies but miss a very large RCT published in JAMA, the VIDARIS trial. All studies (including the VIDARIS trial) show no effect, so they might’ve considered the matter settled and stopped looking for more trials, which seems reasonable.
Claim: Vitamin D helps premenstrual syndrome
”Most studies have found a decrease in general symptoms when given to women with vitamin D deficiency, some finding notable reductions and some finding small reductions. It’s currently not known why studies differ, and more research is needed”
This summary seemed optimistic after Martin looked into the studies:
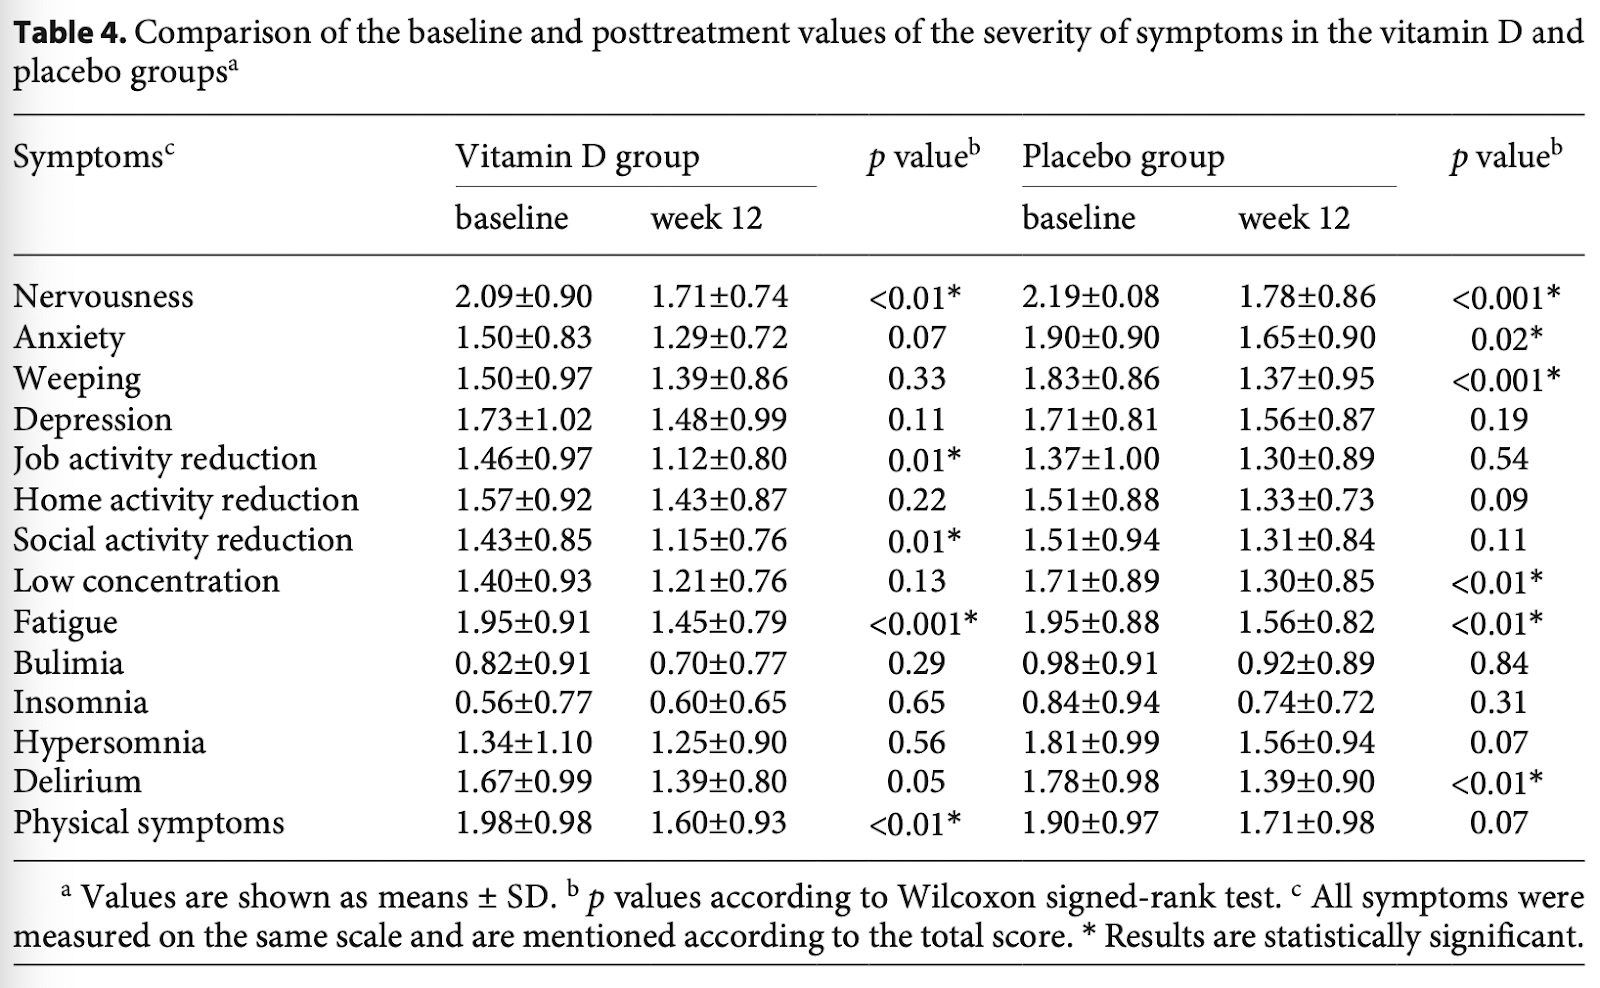
- Abdollahi 2019:
- No statistically significant differences between groups.
- The authors highlight statistically significant decreases for a handful of symptoms in the Vitamin D group, but the decrease is similar in magnitude to placebo. Vitamin D and placebo both have 5 outcomes which were statistically significant.
- Dadkhah 2016:
- No statistically significant differences between treatment groups
- Bahrami 2018:
- No control group
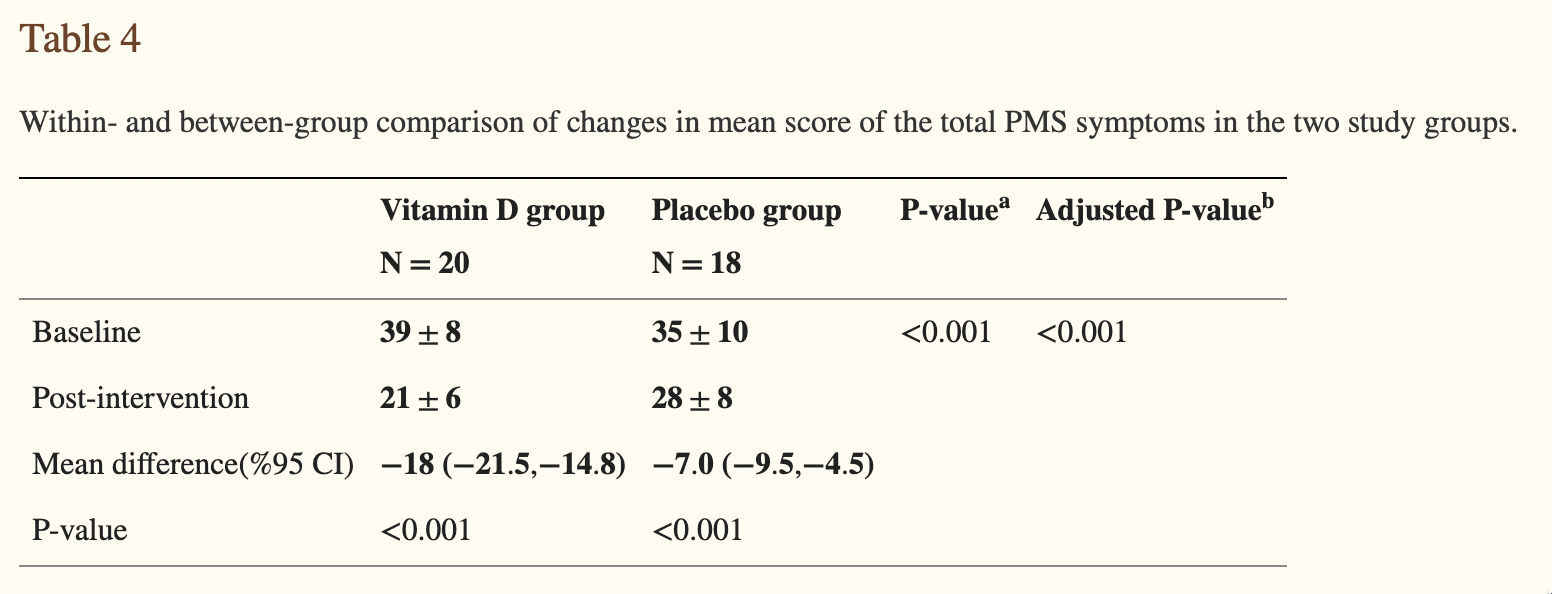
- Heidari 2019:
- Marked differences between groups, but absolutely terrible reporting by the authors – they don’t even mention this difference in the abstract. This makes me (Martin) somewhat worried about the results – if they knew what they were doing, they’d focus the abstract on the difference in differences.:
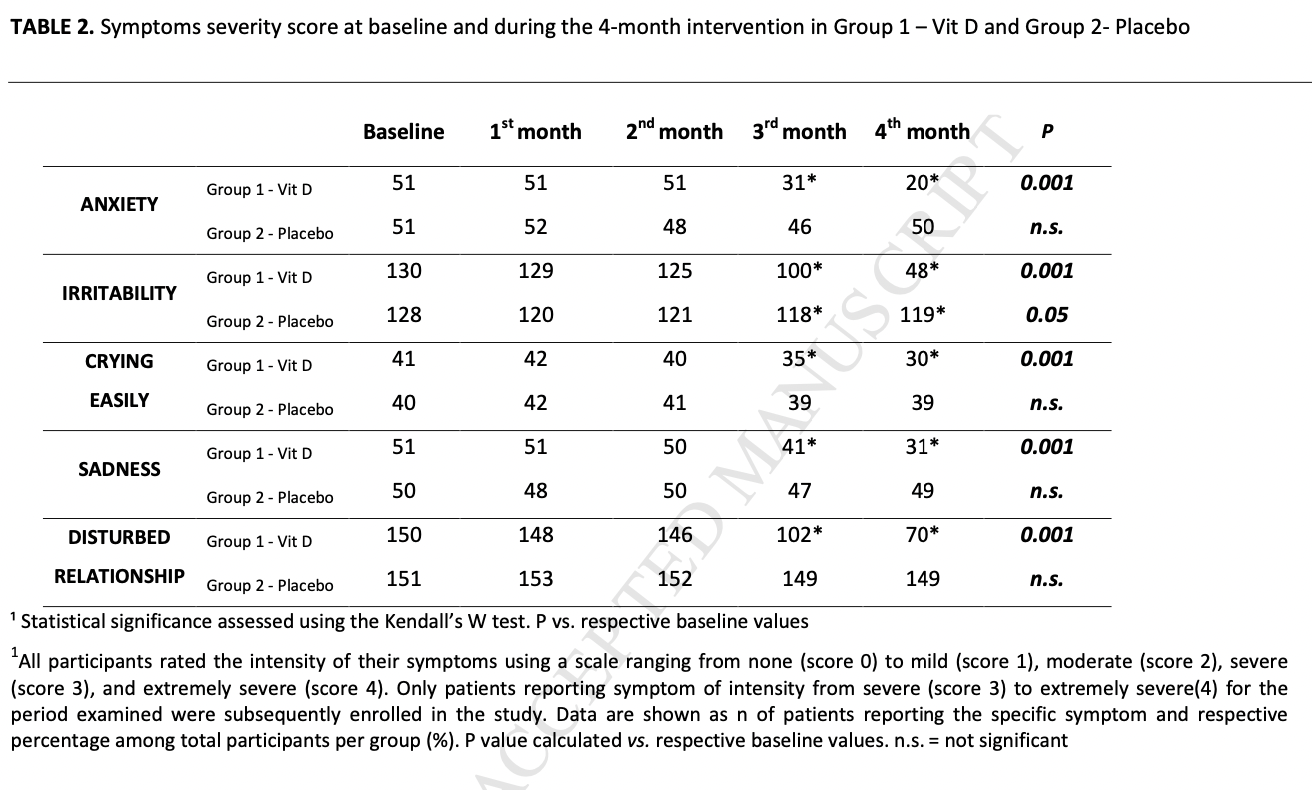
- Tartagni 2015:
- Appears to show notable differences between groups, But terrible reporting. Tests change relative to baseline (?!), rather than differences in trends or differences in differences.
In conclusion, only the poorest research finds effects – not a great indicator of a promising intervention. But Examine didn’t miss any obvious studies.
Claim: “There is some evidence that vitamin D may improve inflammation and clinical symptoms in COVID-19 patients, but this may not hold true with all dosing regimens. So far, a few studies have shown that high dosages for 8–14 days may work, but a single high dose isn’t likely to have the same benefit.”
The evidence Martin found seems to support their conclusions. They’re missing one relatively large, recent study (De Niet 2022). More importantly, all included studies are about hospital patients given vitamin D after admission, which are useless for determining if Vitamin D is a good preventative, especially because some forms of vitamin D take days to be turned into a useful form in the body.
- Murai 2021:
- The regimen was a single, high dose at admission.
- No statistically significant differences between groups, all the effect sizes are tiny or non-existent.
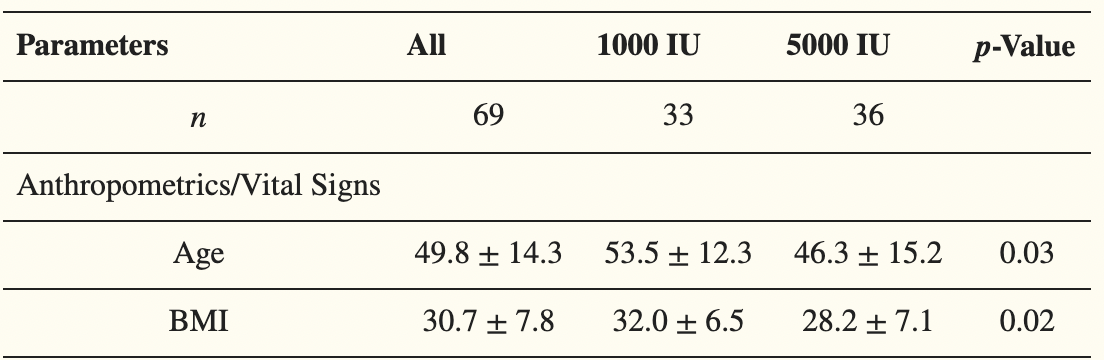
- Sabico 2021:
- Compares Vitamin D 5000 IU/daily to 1000 IU/daily in hospitalized patients.
- In the Vitamin D group, they show faster
- Time to recovery (6.2 ± 0.8 versus 9.1 ± 0.8; p = 0.039)
- Time to restoration of taste (11.4 ± 1.0 versus 16.9 ± 1.7; p = 0.035)
- The Kaplan-Meier Plot looks weird here, though. What happens on day 14?!
- All symptom durations, except sore throat, were lower in the 5000 IU group:

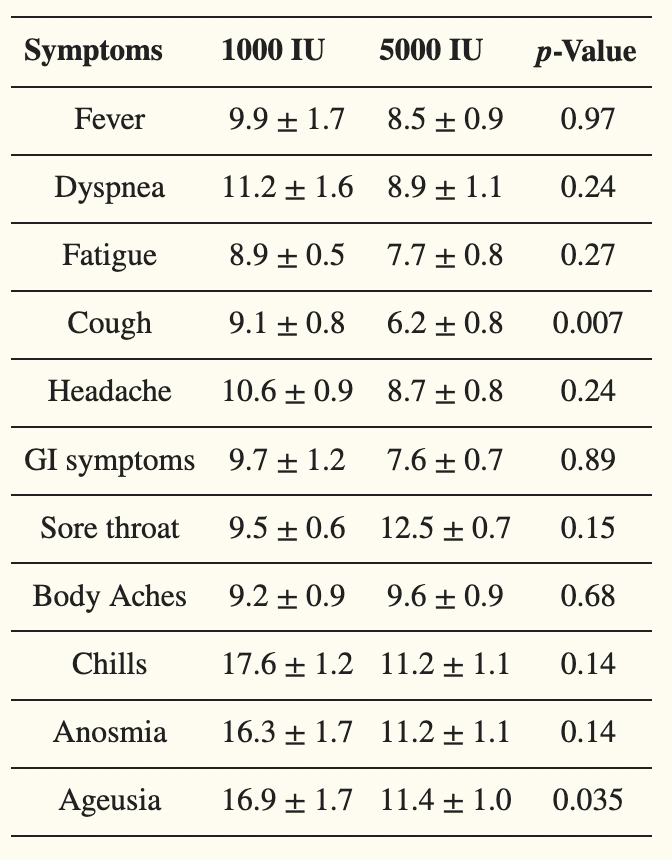
All analyses were adjusted for age, BMI and type of D vitamin – which is a good thing, because it appears the 5000 IU group was healthier at baseline:
- Castillo 2020:
- Huge effect – half of the control group had to go to the ICU, whereas only one person in the intervention group did so (OR 0.02).
- Nothing apparently wrong, but I’m still highly suspicious of the study:
- An apparently well-done randomized pilot trial, early on, published in “The Journal of Steroid Biochemistry and Molecular Biology”. Very worrying that it isn’t published somewhere more prestigious.
- They gave hydroxychloroquine as the “best available treatment”, even though there was no evidence of effect at the time of the study.
- They call the study “double masked” – I hope this means double-blinded, because otherwise the study is close to worthless since their primary outcomes are based on doctor’s behavior.
- The follow-up study is still recruiting.
Conclusion
I don’t know of a better comprehensive resource than Examine.com. It is alas still not comprehensive enough for important use cases, but still a useful shortcut for smaller problems.
Thanks to the FTX Regrant program for funding this post, and Martin for doing most of the work.