
This entry had better save someone’s life because WordPress ate the entirety of the first draft and half the second draft and it was not easy to recreate.
Health at Every Size claim: high blood pressure (hypertension) is not caused by fat, but by dieting (which, because fat people diet more, creates the illusion that fat causes high blood pressure. This is that confound thing we talked about last week).
My reading: The first source it cites does not quite say this: they say that current diet affects blood pressure, regardless of weight (which is actually even better news).* This study (PDF) purely retrospective and found both weight cycling and waist:hip ratio (a measure of fat gain around the waist, and due to the design of the study, a measure of fat itself**) to be significant (also, sample size was very small). The next 2 studies were in obese spontaneously hypertensive rats. Using animal models bred to have the disease you are studying is very common because it reduces the number of subjects needed to generate a statistically significant result, but if the model is suffering from a different root illness that merely causes identical symptoms (e.g. rats bred for leptin deficiency lose fat when given leptin, but leptin-sufficient humans do not). The last source is a book with a name like a perfume store.
Verdict: claim not proven.
HAES claim: hypertension is only associated with bad outcomes in thin people. Fat people with hypertension actually live longer.
My reading: This appears to be true, but all the studies were retrospective, none studies backed out smoking as a confound, and half were in men only. None looked for a dose-dependent effect, but dumped people in two or three buckets and compared outcomes within them. The technical term for this is categorical analysis (the alternative is numeric analysis), and it is almost always a bad choice. Here’s why:
START STATISTICS FIELD TRIP
Let’s imagine that weight affects, and is the only thing to affect, longevity, and that it does so in an exceedingly simple way
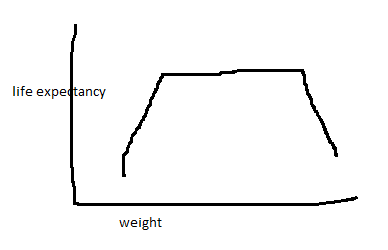
Any idiot can draw the correct inference from this graph: being extremely overweight or underweight is bad, being anywhere in the middle range is equally good. Let’s imagine three naive scientists attempting to study the relationship between weight and longevity.
Scientist A gathers an equal number of people at every weight and sorts them into “low” or “high” weight, with the divider being the exact center of that trapezoid. They conclude weight has no impact on lifespan.
Scientist B draws the low/high line in the same place, but has slightly more extremely overweight people than extremely underweight people (which is what will likely happen in the real world, because 100 pounds overweight is a struggle, but 100 pounds underweight is dead). They conclude being overweight increases chance of death.
Scientist C gets and even distribution of weights, but draws the line to the left of the exact center. Their low-weight group now has a higher percentage of extremely underweight people than the high-weight group has of extremely overweight people. They conclude being underweight increases your chance of death.
And those were good intentioned scientists. A bad intentioned one can gather their data first and set cut off points after to prove almost whatever they want.
END STATISTICS FIELD TRIP
Verdict: After all the crap I’ve given HAES for misrepresenting studies, you might think I’m about to do that again. But actually I find it perfectly plausible that all the studies on weight and blood pressure use categorical analysis, because it’s incredibly common in medical studies. I really hope there’s a good justification for that, but the only one I’ve heard is that the math is easier, which might have made sense when everyone was doing statistics by candle light with a slide rule, but is hard to swallow now given the abundance of software packages that will do it for you. So I will tentatively accept HAES claim as true, but I don’t see how you can turn the claim into actionable suggestions, except to worry less, which is actually an extremely valuable suggestion in this context. So let’s go with “supported, but of limited usefulness.”
*This is your once-per-post reminder that someone who talks about weight or BMI and opposed to body fat percentage is already wrong.
**I spent several very confused minutes googling what “android” meant in context. I assumed the “android” referred to “women”, but android (when it doesn’t mean “obviously superior phone”) means “man-like”, which would make this an extremely unrepresentative study. Turns out that “android” modifies “obesity”, and it means fat growth around the waist and upper body (more often seen in men) as opposed to around the thighs, hips, and breasts (more often seen in women).
